Tools Tab
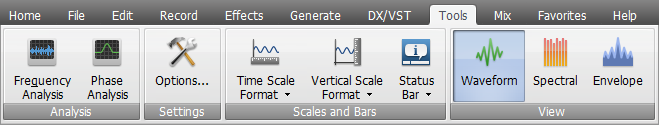
The Tools tab includes the Analysis, Settings, Scales and Bars and View button groups. For information on the Tools Tab command button functions please refer to the table below.
| Analysis |

Frequency Analysis |
Use it to show or hide Frequency Analysis Window. The Frequency Analysis Window contains a graph of the frequencies at the insertion point or at the center of a selection. |

Phase Analysis |
Use it to show or hide Phase Analysis Window. |
| Settings |

Options... |
Use it to view and edit the program settings. |
| Scales and Bars |

Time Scale Format |
Use it to change the format of the horizontal scale which represents the timeline of the audio file. The possible values include: Decimal (mm:ss.ddd), Samples, Frames 60 fps, Frames 59,94 fps, Frames 50 fps, Frames 30 fps, Frames 29.97 fps, Frames 25 fps and Frames 24 fps. |

Vertical Scale Format |
Use it to change the format of the vertical scale which represents the changes of the audio in the file within time. The possible values include: Sample Values, Percentage and Decibels. |

Status Bar |
Use it to show or hide the elements of the Status Bar. The possible items include: Sample Format, File Size and Duration (mm:ss.ddd). |
| View |

Waveform |
Use it to choose a Waveform View mode for viewing data. It displays audio data in the familiar sound wave format, where y-axis (vertical) represents amplitude and x-axis (horizontal) represents time. |

Spectral |
Use it to choose a Spectral View mode for viewing data. It displays a waveform by its frequency components, where x-axis (horizontal) is time, and y-axis (vertical) is frequency. This allows you to analyze your audio data to see which frequencies are most prevalent. |

Envelope |
Use it to choose a Envelope View mode for viewing data. It displays audio data in the familiar sound wave format, where y-axis (vertical) represents amplitude and x-axis (horizontal) represents time. It is the same as the Waveform View but its boundaries are smoothed. |